
The key to customer acquisition success is marketing metrics, and analytics are crucial to that success. By incorporating analytics into your marketing plan, your marketing and sales teams will be able to track the effectiveness of each marketing expenditure. Data helps marketers to clearly identify which aspects of their marketing metrics activities, such as channel performance, particular calls-to-action (CTAs), and individual pieces of content, such as blog posts or gated resource guides, give the best return on investment (ROI).
1. Sale Revenue

The most important statistic for determining how effectively your marketing is functioning is revenue. Why? Because, at the end of the day, a marketing metrics effort might result in tens of thousands of website visits or Instagram likes. However, if it isn’t making income, something is amiss.
When you measure your marketing by income, you get a genuinely objective picture of how well it’s doing. If a channel contributes to cash flow and overall growth, you may justify investing in it.
Monitoring your cash flow can assist you to figure out how well your company is doing overall. It also provides you with a clear image of how much money is coming in and out of your company at any one time. Understanding how to correctly track your cash flow is critical to your survival and growth since many new businesses fail due to a lack of funds. Read our comprehensive guide to accounting for startups to learn more.
2. Site traffic
Total Visits
This is the big picture figure you should keep an eye on and watch overtime to get a sense of how effective your efforts are at driving traffic. This number should rise continuously over time; if it falls month after month, it’s necessary to investigate your marketing metrics channels to figure out what’s wrong.
Channels
This is useful for segmenting your traffic sources in order to figure out which ones are outperforming and which ones are underperforming in your overall marketing metrics. In general, these should be broken down into the four channels/sources listed below:
- Direct visitors are those that arrive at your site by typing the URL into their browser.
- Visitors who arrive at your site as a result of a search query are known as organic/search visitors.
- Visitors that came to your site via a link from another website or blog are known as referrals.
Social Media – If you have a social media presence (and who doesn’t? ), you’ll want to track how many people come to your site from those platforms. Because social traffic is an excellent measure of engagement and awareness, it also gives you some general insight into the overall efficacy of your content marketing metrics and other digital activities.
Bounce Rate

The bounce rate is the percentage of visitors who come to your site and leave without taking any action. A high bounce rate can indicate a number of issues with your digital marketing strategy: Poor campaign targeting, ineffective traffic sources, and shoddy landing sites, to name a few issues.
Your bounce rate is equivalent to your abandonment rate if you have an e-commerce site, and this frequently signals issues with your checkout process. Is the pricing system open and transparent? Do you entice people with last-minute deals? Spend some time thinking about how you can optimize the checkout process.
Exit Rate
This measure is particularly useful for websites with a multi-page conversion process. The exit rate differs from the bounce rate in that it counts the number of individuals who departed the site after viewing a specific page as a percentage of the total number of persons who visited that page. This assists you in identifying conversion process drop-off spots so that you may optimize accordingly.
3. CPC & ROI
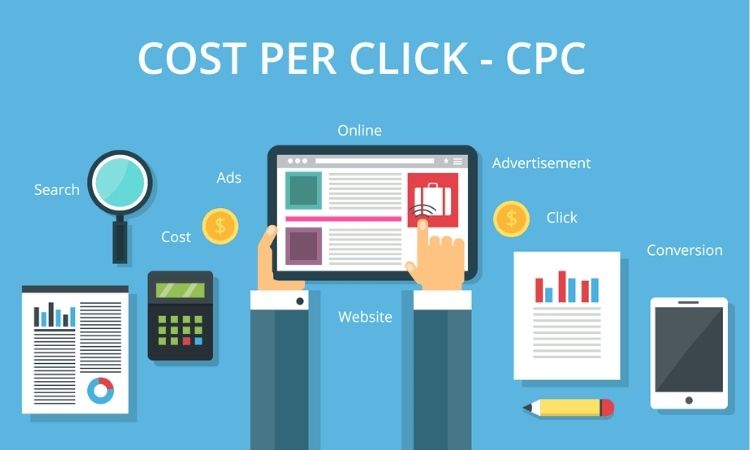
CPC
Because CPA is all about income, it differs from cost per conversion. This statistic kicks in once someone becomes a paying customer, which is the Holy Grail of marketing. CPA informs you exactly how much money you need to spend on marketing to persuade someone to open his wallet.
It’s easy to get caught up in metrics like cost per click, which you must track in paid ads, but this is a short-sighted approach. Consider this scenario: you’ve created a new PPC campaign that appears to be functioning well—your CTRs are higher than previous campaigns, and your CPC is lower.
However, when you look at your income, you’ll see that you’ve only had three or four paying clients, implying that your whole marketing metrics spent on that channel haven’t added anything to your bottom line. In this situation, your marketing metrics numbers appear to be excellent, but your CPA is exorbitant. Your CPA keeps the broad picture in mind at all times.
ROI
This is how you’ll know if your marketing campaign was a success: Are your marketing metrics technology and efforts profitable and generating revenue for your company? Your lead-to-close ratio will come into play here to keep you on pace. If you spend $25 per lead and your closing rate is 25%, acquiring a new customer will cost you $100. If your average customer value surpasses that amount, your marketing metrics ROI is anticipated to be positive.
You may or may not want to explicitly measure each of these indicators, depending on where you are on the digital marketing metrics, but doing so will give you a very realistic picture of how you’re doing, which channels are effective, and where your efforts need to improve. Ideally, you’ll develop a routine that allows you to quickly spot trends and variations and make quick modifications to maintain a consistent flow of leads and paying clients.
4. ROAS
The return on ad spend (ROAS) is among marketing metrics that calculate the amount of money made for every dollar spent on an advertising campaign. As a result, it gives you a comprehensive, big-picture view of whether or not a campaign is paying off.
ROAS is frequently expressed as a percentage. For example, if you made $800 in income from a $100 Facebook Ads campaign, your return on investment (ROI) would be 8:1, or $8 for every $1 spent.
ROAS is comparable to ROI (return on investment), except it only considers the monetary results of a single advertising campaign.
5. Conversion Rate
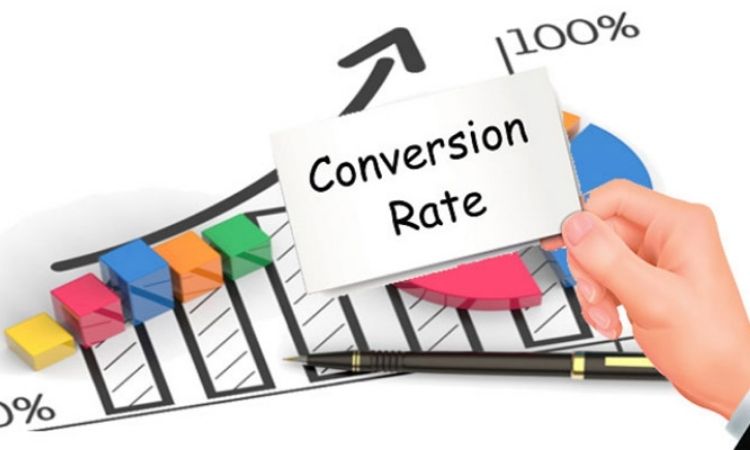
Simply said, your conversion rate is the percentage of visitors who convert on your website or landing page. Converting refers to whatever you choose as an “objective.” The conversion measure is very dependent on your business objectives; conversion can be virtually anything, but the following are the most prevalent types:
- Buying from your website
- Receiving a call Entering an online chat session Submitting a contact or lead generation form Submitting a subscription
- Create a user account.
- Using a feature of your app or a tool, you can download anything.
- Increasing the value of your current plan
- Time spent, number of pages viewed, and other specific metrics
There are several conversion actions; these are only a few of the most prevalent. I believe you now have a better understanding of what a conversion rate is. It’s basically any measurable action that moves a customer from point A to point B on their way to becoming a paying customer.
6. Customer Retention Rate
There are several conversion actions; these are only a few of the most prevalent. I believe you now have a better understanding of what a conversion rate is. It’s basically any measurable action that moves a customer from point A to point B on their way to becoming a paying customer.
It’s the proportion of clients who choose to stick with your company. This number shows how effective your retention methods are. The higher your retention rate, the more successful your company is. Based on your business needs, you can determine Customer Retention Rates on an annual, monthly, or weekly basis. Your retention rate is complemented by your attrition rate. The retention rate is 85 percent if the attrition rate is 15 percent.
The number of times you compute churn rate in a year is entirely dependent on the size of your company. If your customer base is small, calculating the turnover rate every quarter is pointless because you can’t draw any conclusions from the data.
7. Social Media Engagement

It’s difficult to keep track of engagement because it’s such a broad term.
The engagement rate is a measure that is frequently used to determine how engaged your audience is with your content and how effective your brand efforts are. Consumers who are engaged interact with brands through “likes,” “comments,” and social sharing.
The amount and frequency with which audience accounts connect with your account are referred to as engagement. Every social media platform will have an engagement measure that is the aggregate of smaller interaction possibilities like likes, comments, and shares. Many platforms have multiple types of metrics or various naming conventions, such as Retweets vs. Shares, for example.
High engagement rates imply audience health (how responsive your audience is, and how many of your followers are “genuine”), interesting content kinds, and brand awareness.
A measure known as a share of voice is frequently employed in public relations, as well as in competitive research and paid advertising campaigns. It shows how much of the online world your company is involved in. If you’re a florist in Toronto, for example, you might want to see how many people are talking about your brand online in comparison to your competitors.
Engagement, impressions, and reach, the share of voice, referrals, and conversions, and response rate and time are the most prevalent and frequently significant KPIs to monitor. When you combine these, you’ll have a 360-degree perspective of your social media performance. You’ll add new and more sophisticated indicators as time goes on and new goals are set, making them more relevant to your organization.
8. Marketing Qualified Lead (MQL)
A Marketing Qualified Lead (MQL) is a metric that marketing teams use to assess the quality of leads they create and pass along to sales. Most marketing teams have MQL targets, such as the quantity of MQLs and the acceptance rate, for example, the number of leads that become Sales Accepted Leads. This statistic brings sales and marketing metrics together and allows both teams to structure talks around demand generation activities from an organizational standpoint.
Combine MQLs with Sales Accepted Leads (SAL) to evaluate your SAL: MQL ratio over time when you pass a qualified prospect over to sales to understand your lead funnel efficiency.
9. Sales Qualified Lead (SQL)
A Sales Qualified Lead (SQL) is a prospect who meets the requirements of the sales process. SQLs are in the middle of the sales funnel, having been qualified by marketing metrics or a lead generation team, and are now ready to move on to the next stage. Marketing Qualified Leads (MQL) and Sales Qualified Leads (SQL) are at the crossroads of marketing and sales departments. When you have a thorough understanding of both MQLs and SQLs, it’s easier to define team roles.
Keep in mind that when Marketing gives over a Marketing Qualified Lead (MQL), the lead has raised their hand and is interested in learning more, but isn’t ready to buy just yet.
10. Domain Authority (DA) and Page Authority (PA)
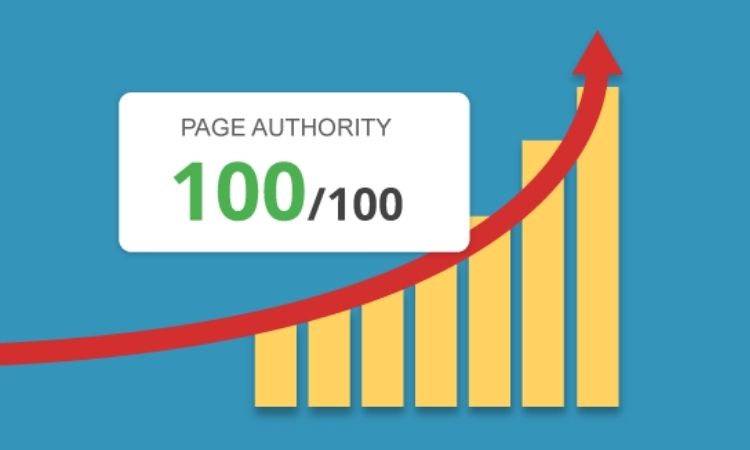
Domain Authority (DA) is a statistic that Moz uses to create SEO tools. It was created to forecast how well a website would rank in search engine results pages (SERPs). The DA scale runs from 0 to 100. Higher scores indicate a better chance of ranking high in the SERPs. Low scores marketing metrics suggest that your page may not appear near the top of the search engine results pages (SERPs).
Because it’s a predictive metric, it’s best employed as a relative rating rather than an absolute one — you should aim for a higher DA than your competitors, but you don’t have to aim for a perfect 100 DA. You may be reasonably confident that your content will fulfill its objectives as long as your score is higher than your competitors’.
Page Authority (PA) is a Moz indicator that predicts how well a specific page will rank in the SERPs. It’s similar to Domain Authority, however, it just looks at specific pages rather than entire domains. PA ratings, like DA, run from 0 to 100, with higher scores indicating a higher likelihood of ranking high in the SERPs and vice versa.
Age Authority is graded on a logarithmic scale, which implies that increasing your score from 80 to 90 is more difficult than increasing it from 1 to 10. PA 1 is the starting point for all pages.
Conclusion
It’s all too simple to pledge to try out all of the marketing metrics with no specific goals in mind; however, this won’t help you because you won’t know where to focus. When the above marketing metrics improve, it shows your company is providing a lot of value to customers while also generating a lot of revenue.
Read more:
- Tik Tok Ads for eCommerce: New Marketing Trends in 2021
- 10+ Best Twitter Analytics Tools to Drive Your Conversions Effectively
- Stop Making These Tik Tok Marketing Mistakes To Boost Sales Crazily in 2021
- Top 15+ Deadly Google Ads Mistakes That Waste Your Money
- Top Powerful Content Writing Tools For SEO to Generate Sales 2021